Live and Dead Cell Assay (ab115347)
")
Key features and details
- Detection method: Fluorescent
- Platform: Flow cytometer, Fluorescence microscope
Overview
-
Product name
Live and Dead Cell Assay
See all Live dead cell kits -
Detection method
Fluorescent -
Product overview
Live Dead Assay Kit ab115347 differentially labels live and dead cells with fluorescent dyes with a one-step live dead assay protocol. It is used for the rapid quantitation of cell viability using flow cytometry or fluorescent microscopy.
The Live Dead assay staining solution is a mixture of two fluorescent dyes that differentially label live and dead cells.
The Live cell dye labels intact, viable cells green. It is membrane permeant and non-fluorescent until ubiquitous intracellular esterases remove ester groups and render the molecule fluorescent. The Excitation (max) and Emission(max) are 494nm and 515nm (similar to FITC).
The Dead cell dye labels cells with compromised plasma membranes red. It is membrane-impermeant and binds to DNA with high affinity. Once bound to DNA, the fluorescence increases >30-fold. The Excitation (max) and Emission(max) are 528nm and 617nm.
The Live Dead assay protocol uses a one-step staining procedure that is simple and fast. It can be used directly in cell culture media.
-
Notes
This assay is not suitable for use with fixed cells / cell fixation.
The Live Dead assay staining solution provided is sufficient for ~1000 assays.
Related assays
Review the cell health assay guide to learn about kits to perform a cell viability assay, cytotoxicity assay and cell proliferation assay.
-
Platform
Flow cytometer, Fluorescence microscope
Properties
-
Storage instructions
Store at -20°C. Please refer to protocols. -
Components 1000 tests 1000X Live/Dead Cell stain in DMSO 1 x 0.1ml -
Research areas
-
Relevance
Distinguishing between live and dead cells is very important for investigation of growth control and cell death.
Images
-
Functional Studies - Live and Dead Cell Assay (ab115347)
Dot plots showing live/dead analysis of vehicle or drug treated Jurkat cells (day 3 of treatment). The indicated drug is used to induce cell death. Live cells are on the y-axis and dead cells are on the x-axis. The red polygongate identifies live cells and the number indicates the percent of live cells.
-
 Functional Studies - Live/Dead Cell Assay (ab115347)
Quantification of % viable cells of Jurkat cells treated with a dose response of the inidicated drug (to induce cell death) and analyzed using the live/dead assay stain on days 1, 2 and 3 using flow cytometry.
-
 Functional Studies - Live/Dead Cell Assay (ab115347)
The sample dot plots demonstrate varying ratios of live and dead cells. More green = upper left = live cells; more red = lower right = dead cells.
-
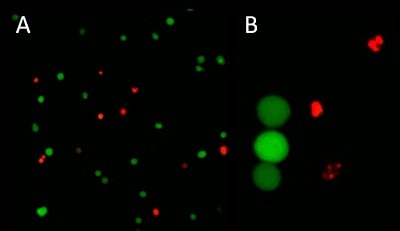 Functional Studies - Live/Dead Cell Assay (ab115347)
Jurkat cells stained with the live/dead assay kit. Jurkat cells treated with a drug to induce cell death were labeled with the live/dead assay stain. Live cells (with esterase activity) stain green and dead cells (compromised plasma membrane) stain red. (A) Field of cells following 10 minute staining in media of live/dead stain. (B)Magnified view showing that in live cells the whole cell is stained green whereas in dead red cells it is the fragmented nuclear DNA that is stained.
Datasheets and documents
-
SDS download
-
Datasheet download
References (47)
ab115347 has been referenced in 47 publications.
- Hsueh YH et al. Therapeutic effect of induced pluripotent stem cell -derived extracellular vesicles in an in vitro and in vivo osteoarthritis model. J Orthop Translat 38:141-155 (2023). PubMed: 36381245
- Rosmark O et al. A tunable physiomimetic stretch system evaluated with precision cut lung slices and recellularized human lung scaffolds. Front Bioeng Biotechnol 10:995460 (2022). PubMed: 36263353
- Döhla J et al. Metabolic determination of cell fate through selective inheritance of mitochondria. Nat Cell Biol 24:148-154 (2022). PubMed: 35165416
- Bolanta SO et al. Synthesis of Poly(acrylic acid)-Cysteine-Based Hydrogels with Highly Customizable Mechanical Properties for Advanced Cell Culture Applications. ACS Omega 7:9108-9117 (2022). PubMed: 35350353
- Jia H et al. Injectable hydrogel with nucleus pulposus-matched viscoelastic property prevents intervertebral disc degeneration. J Orthop Translat 33:162-173 (2022). PubMed: 35415072